Running it · Monitoring
Monitoring, logs and alerts
How we find out something is wrong before a client or a scorer tells us, and trace it to the cause in minutes.
In one minute
Today, alerts reach nobody. Prometheus has 5 alert rules but no receiver. The Slack alerter for failed deliveries only writes a log line. During the Asian Games, every problem was found by a person looking.
The agreed design is one central alert service in our own repo. Code adds a row to alert_signal at the moment something fails, in the same transaction as the failure. A checker looks at our own numbers every 15 seconds and adds rows too. The alert service folds all those rows into one open alert per problem, sends it once to Slack, email or the console, updates that same message as things change, and closes it when the cause clears.
Every background process beats every 10 seconds, so a dead worker and a stuck worker are both found in 30 to 60 seconds. One trace id follows a change from the scorer's tap to the client's file, and every service writes JSON log lines with the same fields.
What is not built yet: all of the alert service. The AWS pieces (a CloudWatch alarm on the alert service, email through SES, the Slack token in Secrets Manager, lasting Prometheus storage) wait for Section 14. Until then, the console shows a red banner when the alert service has not beaten for 60 seconds.
What this part does
This part answers one question for the whole system: is omnium keeping its promises right now, and if not, who knows about it? Sections 3 to 9 each promised alerts "through the central alert service". This section builds that service and everything that feeds it.
The user's original ask was short: "we should have a centralized alerts system". The design turns that into eight questions.
| # | Question | Why it matters |
|---|---|---|
| 1 | When something breaks, who is told, how fast, and how do we avoid telling them 50 times? | During the Games, problems were found by people looking, not by alerts |
| 2 | What does every log line carry, so one change can be followed from the scorer's tap to the client's file? | Today a problem means searching several services' logs by time |
| 3 | Which few numbers tell us the product works? | Write time, import health, feed freshness, delivery age and queue lag are the promises made in Sections 1 to 9 |
| 4 | How do we know a background worker died or is stuck? | A stopped worker looks exactly like a quiet day |
| 5 | Where do staff see health and alerts? | The console team should not need Grafana to know a client is behind |
| 6 | How long do we keep logs, numbers and run records? | Run tables grow every minute of every event |
| 7 | How do we make sure watching never slows scoring? | Everything must stay in milliseconds at scale |
| 8 | What happens when the monitoring itself breaks? | A silent alert service is worse than none, because we trust it |
What we have today
We have most of the parts, but none of them tells a person. This was checked in the code on 7 Oct 2026.
| Part | Today |
|---|---|
| Logs | The public API writes JSON lines with a request id. The admin API sets up no log handler. The scheduler, stats worker and delivery worker write plain text, with a few JSON event lines from the worker's own helper |
| Numbers | Prometheus scrapes all five services every 15 s and keeps 15 days, inside the container. Grafana has 3 dashboards: infra, operations, match day |
| Tracing | OpenTelemetry is set up in the public API only, and it is off by default |
| Alert rules | 5 Prometheus rules, and nowhere to send them |
| Health checks | The admin API, scheduler and stats worker answer a fixed "ok" without checking anything. The delivery worker answers 503 when its loop runs late |
| Heartbeats | Only the delivery worker has one, and it is a log line every 30 s |
| Error tracking | None (no Sentry or similar) |
How it works
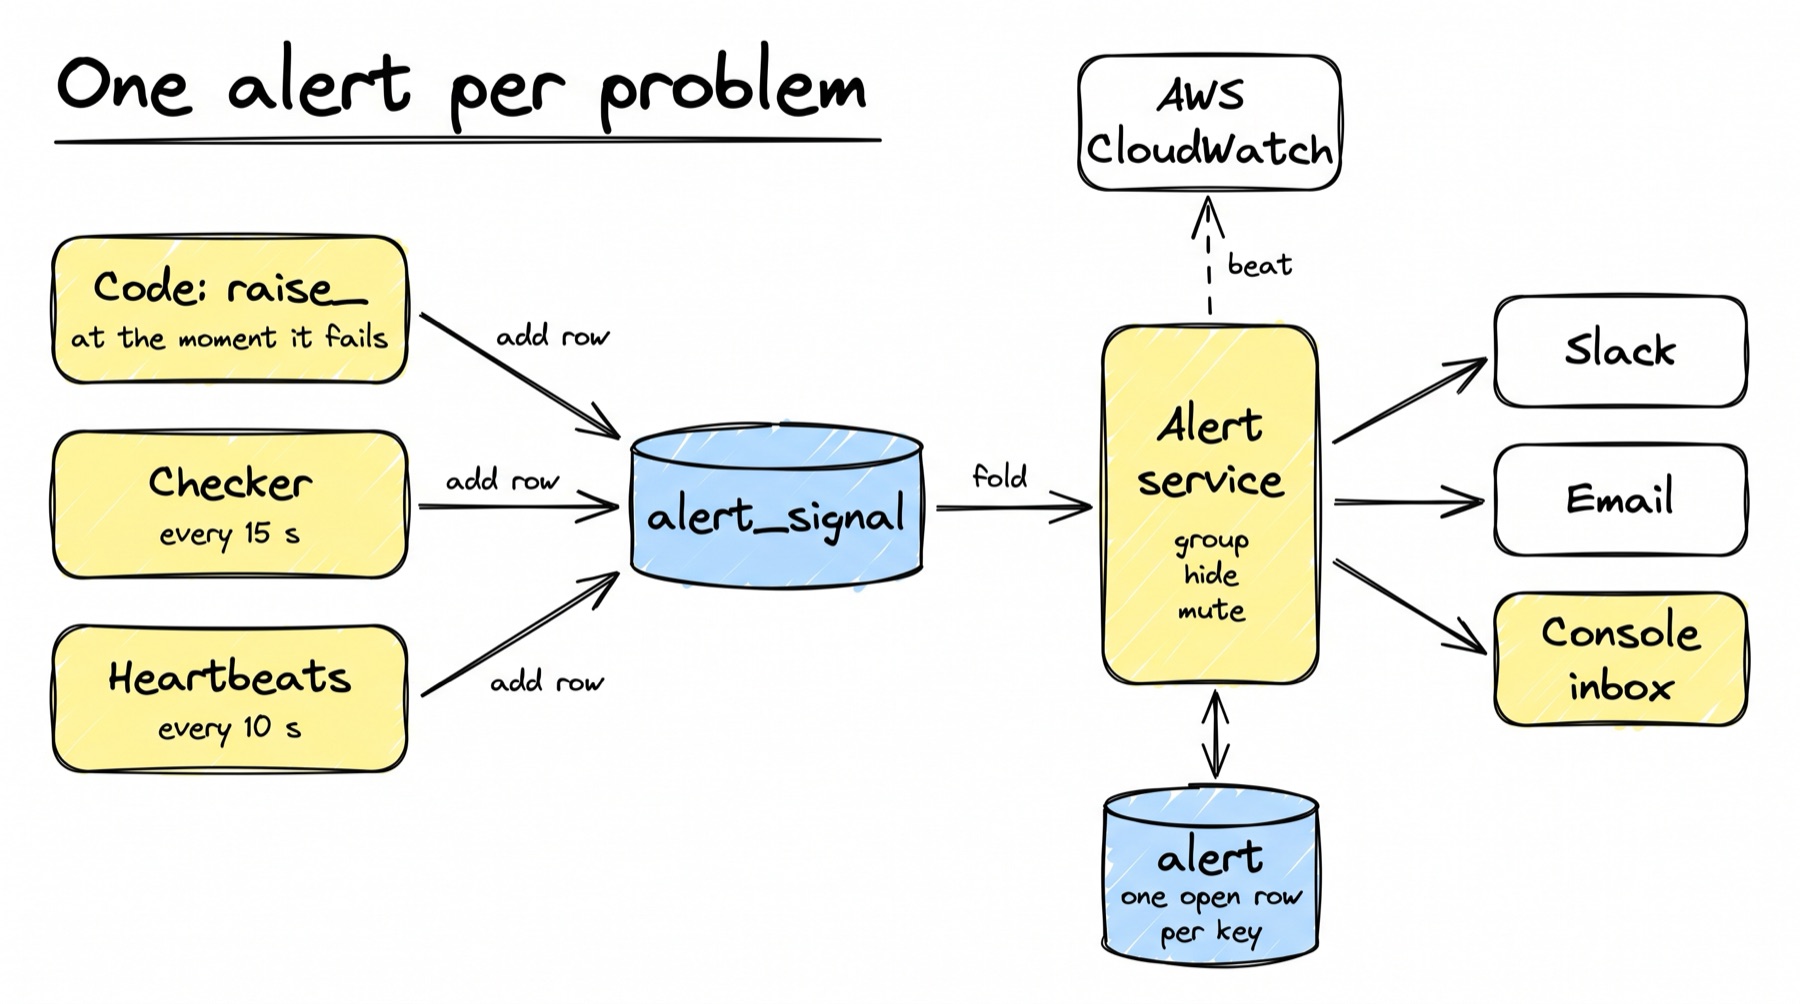
Two kinds of input feed one service, and one service feeds three channels.
- Code raises an alert in one line. When something fails, the code calls
alerts.raise_(session, rule, subject, detail). That adds one row toalert_signalinside the same transaction as the failure. If the transaction rolls back, the signal goes too. - A checker looks at our numbers every 15 seconds. It runs a short list of named queries against tables we already keep (delivery state, import runs, heartbeats). Each breach adds a "raise" signal. Each subject that is healthy again adds a "clear" signal.
- Every background process beats. Each one writes a
process_beatrow every 10 seconds. The checker reads those rows to find silent and stuck workers. - The alert service folds signals into alerts. It reads new signals with the same reader the outbox uses, groups them by key, and updates the
alerttable. There is at most one open alert per key, and the database enforces it. Repeats only raise a count. - It decides what to send. It applies mutes and root alerts, then the timing rules (30 s to group, 5 minutes between updates, 4 hours between reminders), then the route for the alert's team.
- It sends, and records the send. Critical goes to Slack and email. Warning goes to Slack. Info stays in the console. Each Slack alert is one message that is edited in place as the alert changes.
- People act in the console. They acknowledge ("I have it"), mute with a reason, or resolve with a note. Each is a workflow command, so it is recorded with who and why.
- Someone watches the watcher. The alert service beats to AWS CloudWatch. If it goes silent for 60 s, AWS raises an alarm. Until that is set up (Section 14), the console shows a red banner.
Event rules and condition rules
Some problems are moments. Others are states. Both end as one alert.
| Event rules | Condition rules | |
|---|---|---|
| Who raises them | Code, at the moment it fails | The checker, every 15 s |
| Examples | A command refused after 5 tries, a replay mismatch, sport code missing, a Scout run that failed | A destination 60 s behind, no import run for three intervals, a worker that stopped beating, a lock wait over 1 s |
| How they resolve | A person resolves them, with a note | By themselves, when the number is healthy again |
The life of one alert
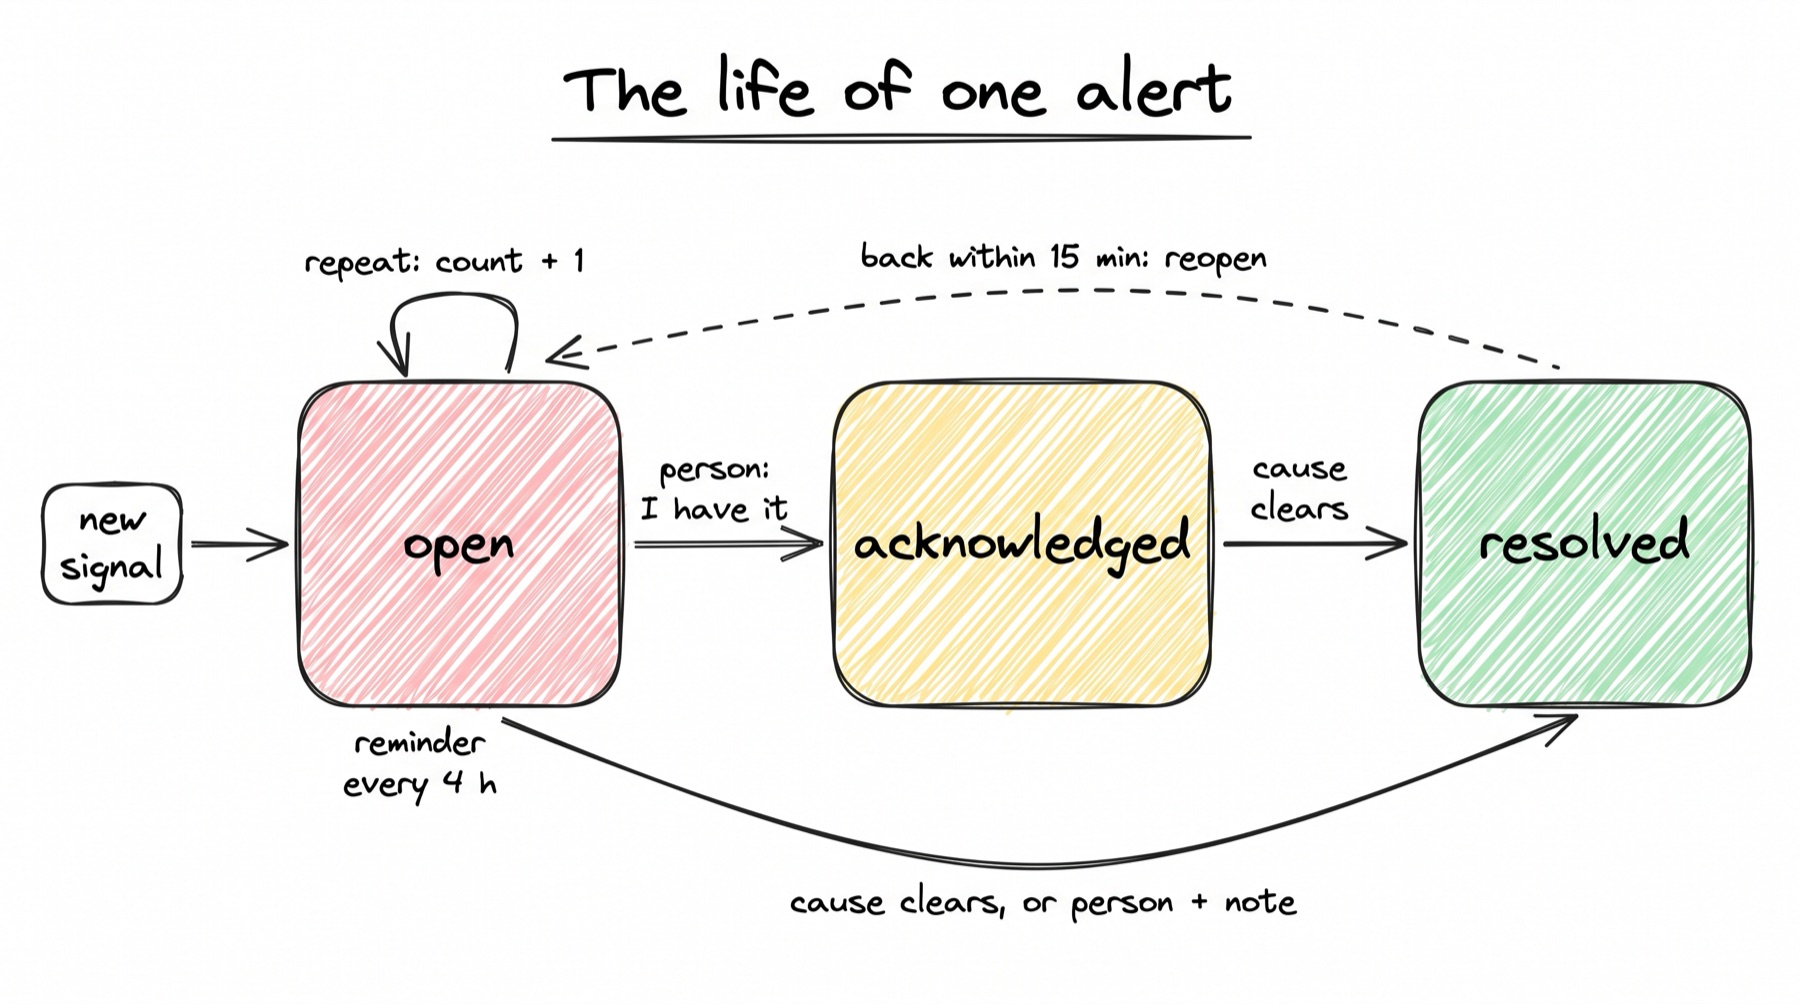
| State | Means | What moves it on |
|---|---|---|
open | Something is wrong and nobody has said "I have it" | A person acknowledges; or the cause clears |
acknowledged | A person owns it. Reminders stop | The cause clears (condition rules), or a person resolves it with a note (event rules) |
resolved | Closed. resolved_by is empty when it closed by itself | A new raise within 15 minutes reopens the same row |
Group, hide, mute
These three ideas come from Prometheus Alertmanager. We build them inside our alert service.
- Group. One message for many alerts of one rule, such as "3 NDTV files behind". The list is in the console.
- Hide. While a root alert such as "database unreachable" is open, the alerts it causes downstream are kept but not sent. They point at the root through
alert.root_alert_id. - Mute. A person mutes a rule or a subject for a set time, with a reason, for example during planned work. If the alert is still open when the mute ends, it is sent again.
Timing
| Setting | Default | What it does |
|---|---|---|
| Group wait | 30 s | Wait before the first message, so related alerts arrive in one message |
| Update every | 5 min | The least time between two edits of one alert's message |
| Repeat every | 4 h | A reminder while nobody has acknowledged it |
| Reopen within | 15 min | A return inside this window reopens the same alert |
These match Alertmanager's own defaults. They are fast enough to act on and calm enough not to be ignored.
Heartbeats: silent and stuck
A stopped worker looks exactly like a quiet day. Heartbeats tell the two apart.
- Silent. Every background loop writes its own
process_beatrow every 10 s: the command service with its sport workers and its import process, the delivery-worker's build and send loops, the stats-worker's stats and timed-job loops, and the alert service. Three missed beats (30 s) raiseworker-silent. Because each loop beats on its own, a stuck import is caught even while scoring beside it is fine. - Stuck. A process can be alive and still do nothing, for example waiting on a hung network call. The beat comes from the work loop and carries
progress_at, the time of the last finished item. Work waiting with no progress for 60 s raisesworker-stuck, even while the process still beats. - Database time. Beats and ages are compared with the database clock, never the process clock. A process with a wrong clock cannot fool the check.
One trace id through everything
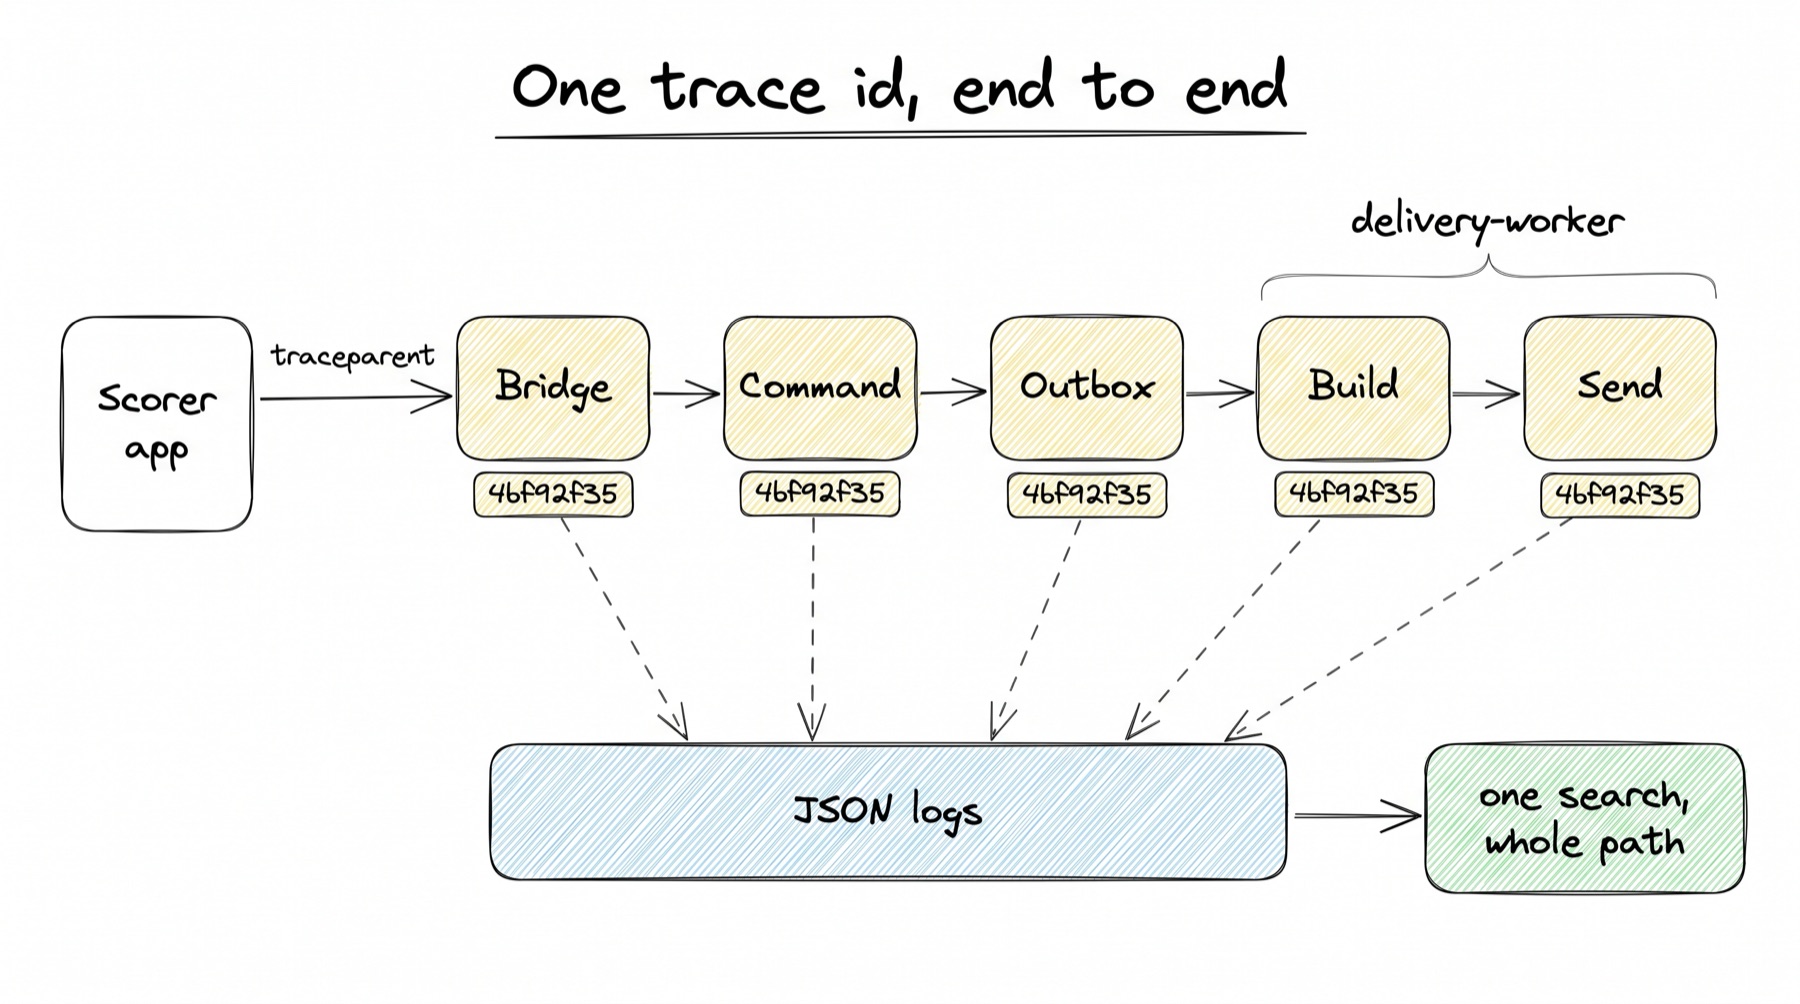
A trace id is a short id that is stamped on every log line and row that belongs to one change. The bridge accepts a standard W3C traceparent header, or makes one. The id is saved on the command and the outbox row, and carried by the delivery-worker as it builds and sends. Every log line is JSON with the same fields: trace id, command id, subject, workflow, client, outcome and time taken.
One search for a fixture, a command or a trace id then shows the whole path of a change. The alert carries the trace id too, so "show logs" on an alert opens exactly the right lines.
The product numbers
We alert on what clients and scorers feel, not on CPU graphs. CPU and memory are for finding a cause, not for waking someone.
| Number | Target or limit | From |
|---|---|---|
| Command time | under 30 ms at the 95th percentile | Section 4 |
| Import freshness | no new run for three intervals is an alert | Section 3 |
| Feed freshness | 10 s | Section 9 |
| Delivery age per destination | 60 s behind is an alert | Section 9 |
| Queue lag | age of the oldest waiting job | Section 9 |
| Lock waits | over 1 s is an alert | Section 4 |
| Pull hits and Redis hit rate | shown on the Health page | Section 8 |
Speed and freshness alerts look at two windows at once: the last hour and the last 5 minutes. Both must be bad. One slow spike does not alert anyone, and a fixed problem stops alerting about 5 minutes after it is fixed, not an hour later. This is the method from the Google SRE workbook chapter "Alerting on SLOs".
A worked example
Example · DailyHunt's SFTP host hangs at 14:02
This follows the agreed design. None of it runs today. Times and counts are example values. DailyHunt gets 7 feeds over SFTP, one delivery_assignment row per feed. Two of those feeds change in the first minute: medals_tally and calendar. The example assumes each send has a time limit, like FTP's 30 s today (see the note after the example).
- 14:02:00. DailyHunt's SFTP host stops answering. Connections open but never finish.
- 14:02:04. The delivery-worker rebuilds the medal tally file. Its
feed_documentrow now has a newerseqthan DailyHunt'sdelivery_state.last_seq. The delivery worker tries to send. The send hangs until its time limit, then fails.delivery_state.failuresgoes up andstatusbecomesretry. - 14:02:20. The calendar file changes too. Same story for the second assignment.
- 14:03:15. The checker runs its
delivery-behindquery. Both DailyHunt assignments have a newer file that is more than 60 s old and not delivered. The checker adds two "raise" rows toalert_signal, subjectsassignment:<medals id>andassignment:<calendar id>, and wakes the alert service withpg_notify. - 14:03:15, a few ms later. The alert service folds the two signals. No open alert exists for either key, so it opens two
alertrows: ruledelivery-behind, severitycritical, stateopen, count 1. It writes analert_eventrow "raised" for each. - 14:03:45. The 30 s group wait ends. Both alerts share a rule, so they go out as one message. The rule's team route says critical means Slack and email. The service writes an
alert_sendrow as "sending", posts to Slack, then saves Slack's message id as the receipt. Email follows once SES is set up (Section 14). The message reads "DailyHunt SFTP: 2 files behind, oldest 1 min 41 s", with a link to the console. - 14:03:30 onwards. Every 15 s the checker raises again. The alerts'
countandlast_atrise. No new message is sent. - 14:05:10. The on-call engineer opens the alert in the console and acknowledges both. That is the
ops.acknowledge_alertcommand. The state becomesacknowledged,acknowledged_byis set, and the Slack message is edited in place to show who has it. The 4-hour reminder will not fire. - 14:05:30. The engineer clicks "show logs". The search uses the trace id saved on the alert and shows the delivery lines with
sftp connection error: TimeoutError. The cause is outside us. The engineer messages DailyHunt. - 14:08:45. Five minutes after the first message, the service is allowed to edit it again: "oldest 6 min 41 s", count now 23 per alert.
- 14:11:30. DailyHunt's host answers again. The next sends work.
delivery_state.last_seqcatches up andfailuresgoes back to 0. - 14:11:45. The checker finds both subjects healthy and adds two "clear" rows. The alert service resolves both alerts with
resolved_byempty, which means "resolved by itself". The Slack message is edited one last time: "Resolved after 8 min 30 s". - 14:20:00. The host hangs again. This is within 15 minutes of the resolve, so the service reopens the same two alert rows instead of making new ones. History stays on one alert.
Low-level design
The design keeps all alert state in Postgres. A command pays one added row, and only when something is wrong. Folding, checking and sending run in a small separate service.
What the code looks like today
These blocks are real code from the repo on 7 Oct 2026, trimmed with .... They show why "none of them tells a person" is true.
The 5 Prometheus rules, with nowhere to go.
# deploy/observability/prometheus/prometheus.yml.tmpl:6-11
global:
  scrape_interval: 15s
  scrape_timeout: 10s

rule_files:
  - /etc/prometheus/alerts.yml
# deploy/observability/prometheus/alerts.yml (one of 5 rules)
  - name: omnium-liveness
    rules:
      - alert: OmniumTargetDown
        expr: up{job=~"omnium-.*"} == 0
        for: 2m
        labels:
          severity: critical
The config loads the rules, so Prometheus works out when they fire. But there is no alerting: block and no Alertmanager, so a firing rule shows only on the Prometheus web page. The 5 rules are IngestPublishLagHigh (over 5 s), IngestPublishBacklog (oldest unpublished over 10 s), OmniumTargetDown, OmniumWorkerUnhealthy and PublishPipelineStalled.
# deploy/observability/prometheus/Dockerfile:20-25
# Retention is a CLI flag (not a config-file field). tsdb is EPHEMERAL (no EFS);
# history resets on task restart ...
CMD ["--config.file=/etc/prometheus/prometheus.yml", \
     "--storage.tsdb.path=/prometheus", \
     "--storage.tsdb.retention.time=15d", \
Prometheus keeps its data inside the container. A restart loses all history.
The Slack alerter for dead letters only logs.
# packages/core/src/omnium_core/publishing/delivery/deadletter.py:137-161 (trimmed)
class SlackDeadLetterAlerter:
    ...
    async def alert(self, entry: DeadLetterEntry) -> None:
        log.warning("slack alert (seam, not sent): %s", self.format_message(entry))
A dead letter is a delivery that failed every retry and was given up. Even when delivery_alerter is set to slack, this class writes a log line and sends nothing. The default is logging anyway (packages/core/src/omnium_core/settings.py:193). Dead letters themselves are kept only in the log by default (delivery_deadletter_backend = "logging", settings.py:189).
A real Slack sender exists, but it is off and nothing calls it.
# packages/core/src/omnium_core/notify/slack.py:64-87 (trimmed)
async def send_slack(text: str, *, settings: Settings | None = None, ...) -> bool:
    """POST ``text`` to Slack asynchronously. Returns True only on 2xx; never raises."""
    cfg = _resolve_settings(settings)
    if not _enabled(cfg):
        return False
    body = _payload(text, username=username or cfg.slack_username, blocks=blocks)
    ...
        resp = await http.post(cfg.slack_webhook_url, json=body)
It posts to a Slack incoming webhook, a fixed URL that can post but never edit a message. slack_enabled defaults to False and slack_webhook_url to empty (settings.py:169-170). A search of the code finds no caller outside its own package and tests. The agreed design changes it into a bot-token client that posts once and then edits the same message (decision N6).
The JSON log formatter, in the public API only.
# packages/api/src/omnium_api/observability/logging.py:28-46 (trimmed)
class JsonFormatter(logging.Formatter):
    def format(self, record: logging.LogRecord) -> str:
        payload: dict[str, object] = {
            "ts": self.formatTime(record, "%Y-%m-%dT%H:%M:%S%z"),
            "level": record.levelname,
            "logger": record.name,
            "message": record.getMessage(),
        }
        request_id = request_id_var.get()
        if request_id:
            payload["request_id"] = request_id
        for key, value in record.__dict__.items():
            if key not in _STD_ATTRS and not key.startswith("_"):
                payload[key] = value
        ...
        return json.dumps(payload, default=str)
request_id_var is a context variable: a value Python keeps per request, so every log line in that request can read it without passing it around. The middleware sets it at packages/api/src/omnium_api/observability/middleware.py:112. The agreed design moves this formatter into core and adds trace id, command id and subject (decision N7).
The workers log plain text.
# packages/worker/src/omnium_worker/__main__.py:196
# (the same line is in scheduler/__main__.py:157 and stats/__main__.py:215)
logging.basicConfig(level=logging.INFO, format="%(asctime)s %(name)s %(message)s")
The worker also has a small JSON helper, log_event (packages/worker/src/omnium_worker/observability.py:329-338), used for a few lines such as the delivery heartbeat. So worker logs today are a mix of plain text and JSON, with no shared fields.
The trace id starts fresh at the outbox.
# packages/core/src/omnium_core/jobs_outbox.py:62-70
    event = DomainEvent(
        kind=kind,
        ...
        trace_id=trace_id or uuid7().hex,
        payload=payload or {},
    )
domain_event already has a trace_id column (packages/contract/src/omnium_contract/models/scheduler.py:45). But the scoring pipeline calls jobs_outbox.emit without one (packages/core/src/omnium_core/scoring/pipeline.py:725-731), so a new id is made here. The request id from the API never reaches it.
Queue numbers are never set outside tests.
# packages/worker/src/omnium_worker/observability.py:226-229
def set_queue_snapshot(snapshot: QueueSnapshot) -> None:
    """Publish what a queue looks like now. Called from the loop, not the scrape."""
    with _queues_lock:
        _queues[snapshot.name] = snapshot
The docstring says the loop calls it. A search finds callers only in packages/worker/tests/test_observability.py. So omnium_queue_depth and omnium_queue_oldest_seconds are always empty, and their Grafana panels are blank.
The only heartbeat is a log line.
# packages/worker/src/omnium_worker/delivery.py:501-503
            if now - last_heartbeat >= heartbeat_seconds:
                observability.log_event("delivery.heartbeat", pending=runner.pending_count())
                last_heartbeat = now
It runs every 30 s (HEARTBEAT_SECONDS = 30.0, line 124). Nothing reads it. The scheduler and the import runner have no heartbeat at all.
The new tables
Agreed, to build Agreed design, not in the code yet. All seven tables are new.
-- Every part writes here, in its own transaction. Rows are only ever added.
CREATE TABLE alert_signal (
  id        bigint GENERATED ALWAYS AS IDENTITY PRIMARY KEY,
  xid       xid8 NOT NULL DEFAULT pg_current_xact_id(),  -- late-commit-safe reader (Section 4, L9)
  rule      text NOT NULL,                  -- 'delivery-behind'
  subject   text NOT NULL,                  -- 'assignment:<id>', shown as "NDTV S3"
  kind      text NOT NULL CHECK (kind IN ('raise', 'clear')),
  detail    jsonb NOT NULL DEFAULT '{}',
  trace_id  text,
  raised_at timestamptz NOT NULL DEFAULT now()
);

-- One row per problem. At most one open row per key.
CREATE TABLE alert (
  id              bigint GENERATED ALWAYS AS IDENTITY PRIMARY KEY,
  key             text NOT NULL,            -- rule || ':' || subject
  rule            text NOT NULL REFERENCES alert_rule (code),
  subject         text NOT NULL,
  severity        text NOT NULL CHECK (severity IN ('critical', 'warning', 'info')),
  state           text NOT NULL CHECK (state IN ('open', 'acknowledged', 'resolved')),
  count           integer NOT NULL DEFAULT 1,
  first_at        timestamptz NOT NULL,
  last_at         timestamptz NOT NULL,
  acknowledged_by uuid, acknowledged_at timestamptz,
  resolved_by     uuid,                     -- NULL with resolved_at set = resolved by itself
  resolved_at     timestamptz, resolve_note text,
  root_alert_id   bigint REFERENCES alert (id),   -- hidden under this alert (A4)
  detail          jsonb NOT NULL DEFAULT '{}',
  trace_id        text
);
CREATE UNIQUE INDEX alert_one_open ON alert (key) WHERE state <> 'resolved';
CREATE INDEX alert_inbox ON alert (state, severity, last_at DESC);

CREATE TABLE alert_event (alert_id bigint REFERENCES alert, at timestamptz, what text, by_user uuid, note text);
CREATE TABLE alert_send  (id bigint PRIMARY KEY, alert_id bigint REFERENCES alert, channel text, target text,
                          status text, attempt int, receipt text, error text, sent_at timestamptz);
CREATE TABLE alert_rule  (code text PRIMARY KEY, kind text, severity text, team text, threshold jsonb,
                          runbook text NOT NULL, enabled boolean NOT NULL DEFAULT true);
CREATE TABLE alert_route (team text PRIMARY KEY, slack_channel text, emails text[]);
CREATE TABLE alert_mute  (id bigint PRIMARY KEY, rule text, subject text, until timestamptz NOT NULL,
                          reason text NOT NULL, by_user uuid NOT NULL);

-- One row per running process, updated every 10 s by its own work loop.
CREATE TABLE process_beat (
  process_id  text PRIMARY KEY,             -- 'delivery:task-3f2a'
  kind        text NOT NULL,                -- one loop: command, sport-worker, build, send, stats, timed-jobs, imports, alerts
  version     text NOT NULL,                -- image tag and code_sha
  started_at  timestamptz NOT NULL,
  beat_at     timestamptz NOT NULL,         -- database time, never the process clock
  progress_at timestamptz,                  -- last item finished
  waiting     integer NOT NULL DEFAULT 0,   -- items queued for this process
  working_on  text
);
What each table is for:
| Table | Written by | Read by | Kept |
|---|---|---|---|
alert_signal | Any code (raise_), the checker | The alert service | 7 days |
alert | The alert service only | Console inbox, bell, detail | 1 year |
alert_event | The alert service, console commands | Alert detail timeline | 1 year |
alert_send | The alert service | Alert detail ("proof of delivery") | 1 year |
alert_rule | Admin panel (ops.edit_alert_rule) | The alert service, checker | settings |
alert_route | Admin panel (ops.edit_alert_route) | The alert service | settings |
alert_mute | Console (ops.mute) | The alert service | settings |
process_beat | Every background process | The checker, Health page | one row per process |
Three details matter most.
alert_signal.xidholds the id of the transaction that wrote the row. The reader uses it to never skip a row that committed late, the same way the outbox does (Section 4, L9). See the database page.alert_one_openis a partial unique index: a unique rule that applies only to rows matching itsWHERE. Here it means "one row per key that is not resolved". The database itself makes sure one problem is one alert, even if two copies of the service ran at once.process_beat.beat_atis set withnow()in the database, never from the process clock.
Raising an alert
Agreed, to build Agreed design, not in the code yet. New file packages/core/src/omnium_core/alerts/api.py.
async def raise_(session: AsyncSession, rule: str, subject: str, detail: dict | None = None) -> None:
    """Add one signal in the caller's transaction. Never updates a row, never waits on a lock."""
    rules.require(rule)                                   # unknown code -> error in tests (A5)
    await session.execute(INSERT_SIGNAL, {"rule": rule, "subject": subject, "kind": "raise",
                                          "detail": detail or {}, "trace_id": trace.current_id()})
    await session.execute(NOTIFY_ALERT)                   # SELECT pg_notify('alert', '')

async def raise_alone(sessions: Sessions, rule: str, subject: str, detail: dict | None = None) -> None:
    """For a failure whose own transaction rolled back, such as a command refused after 5 tries."""
    async with sessions.short() as s:
        await raise_(s, rule, subject, detail)
In plain words:
rules.require(rule)checks the rule code exists in the registry. A typo fails in tests, not in production.- The insert only adds a row. It never updates one, so it never waits for a lock.
trace.current_id()copies the current trace id onto the signal, so the alert can show "show logs".pg_notify('alert', '')wakes the alert service at once. This is the same wake-up the delivery-worker's build uses (Section 8).raise_aloneis for the rare case where the failure is the rollback, such as "command refused after 5 tries". It opens its own short transaction so the alert survives.
A condition rule
Agreed, to build Agreed design, not in the code yet. New file packages/core/src/omnium_core/alerts/checks.py.
@condition("delivery-behind")
async def delivery_behind(s: AsyncSession, t: Threshold) -> list[Breach]:
    rows = await s.execute(sa.text("""
        SELECT s.assignment_id::text AS a,
               max(extract(epoch FROM now() - d.changed_at)) AS behind_s, max(s.failures) AS failures
          FROM delivery_state s
          JOIN feed_document d ON d.doc_key = s.doc_key     -- changed_at: Section 9, E1
         WHERE (d.seq > s.last_seq AND d.changed_at < now() - make_interval(secs => :behind))
            OR s.failures >= :fails
         GROUP BY s.assignment_id"""),
        {"behind": t["behind_s"], "fails": t["failures"]})
    return [Breach(subject=f"assignment:{r.a}", detail={"behind_s": r.behind_s, "failures": r.failures})
            for r in rows]
In plain words:
- A condition rule is a named query in our code. Nobody types SQL into a screen.
- The thresholds (
behind_s60,failures3) come fromalert_rule.threshold, edited in the admin panel. - An assignment is behind when its file has a newer
seqthan the client has, and that change is older than the threshold. It is also in trouble after 3 failures in a row. feed_document.changed_atis a new column from Section 9 (decision E1). Today the table hasupdated_atonly (packages/contract/src/omnium_contract/models/feeds.py:101). Thedelivery_statecolumnslast_seqandfailuresexist today (packages/contract/src/omnium_contract/models/delivery.py:228, 248).- Every check runs with a 2 s statement limit on its own pool of 2 connections. A slow check is cancelled and cannot load the database.
Heartbeats
Agreed, to build Agreed design, not in the code yet. New file packages/core/src/omnium_core/observability/beat.py.
class Beat:
    """Called by the work loop itself, so a stuck loop stops making progress even if the process lives."""
    def progress(self, working_on: str | None = None, waiting: int = 0) -> None: ...
    async def run(self) -> None:                         # every BEAT_EVERY_S
        # INSERT ... ON CONFLICT (process_id) DO UPDATE SET beat_at = now(), progress_at = ..., waiting = ...
        ...
The work loop calls progress() after each item it finishes. run() writes the row every 10 s. If the loop is stuck, progress_at stops moving while beat_at still moves. That is exactly the "stuck" case.
The alert service loop
Agreed, to build Agreed design, not in the code yet. New service packages/worker/src/omnium_worker/alerts/__main__.py.
It is its own small service, so a crash in the delivery-worker or the stats-worker cannot take alerts down with it. Only one copy works at a time: it holds a Postgres advisory lock (a named lock the app takes with pg_try_advisory_lock), and a second copy waits.
- Wake. On
pg_notify('alert', ''), with a safety read every 1 s. - Fold. Read new signals with the outbox reader. Group them by key. Upsert into
alert: open a new one, add to the count, reopen within 15 minutes, or resolve on a clear. Writealert_eventrows. One statement per batch, measured at 64 ms for 47,709 signals. - Check, every 15 s. Run each condition rule. Breaching subjects become raise signals. Open alerts whose subject is healthy again get a clear.
- Send. For each alert that changed, apply mutes and roots, then timing, then the route. Record the send as "sending", call Slack or email, then record the receipt or the error.
- Beat. Write its own
process_beatrow, and send one CloudWatch metric every 10 s. The alarm treats missing data as a breach. - No database. If its own database calls fail for 30 s, it sends "database unreachable" straight to Slack and email from memory, at most once per 15 minutes.
The first rules
These come from the promises in Sections 3 to 9. All are seeded into alert_rule with a runbook (what to do).
| Rule | Kind | Raised when | Severity |
|---|---|---|---|
command-refused | event | A command fails 5 times on our side (Section 4) | critical |
lock-wait | condition | A command waits over 1 s for a lock, or a transaction stays open over 10 s (30 s for an import) (Section 4, L14) | warning |
command-slow | condition | A person's command is over 30 ms at the 95th percentile for both the last hour and the last 5 minutes (Section 4) | warning |
replay-mismatch | event | The background replay differs from the saved state (Section 5) | critical |
sport-code-missing | event | A match needs code that is not installed (Sections 5, 6) | critical |
import-failed | event | A run failed, a batch failed 3 times, Scout failed twice in a row, or a guard held a run (Section 3) | warning |
import-quiet | condition | No new run for three intervals (Section 3) | warning |
provider-quiet | condition | A live provider passes its quiet limit (Section 4) | critical |
delivery-behind | condition | A destination is over 60 s behind, or failed 3 times in a row (Section 9) | critical |
redis-write-failed | event | The Redis destination fails 3 times (Section 9) | warning |
stat-job-failed | event | A stat job fails after its tries (Section 9) | warning |
worker-silent / worker-stuck | condition | 3 beats missed, or work waiting with no progress for 60 s | critical |
unexpected-error | event | An unhandled error, grouped by error type and place (A12) | warning |
metrics-unavailable | condition | The checker cannot read Prometheus | warning |
unexpected-error replaces an outside error-tracking product. Crashes are grouped by error type and place and carry the trace id (decision A12).
Settings
Agreed, to build Agreed design, not in the code yet.
| Setting | Default | What it does |
|---|---|---|
ALERTS_CHECK_EVERY_S | 15 | How often condition rules run |
ALERTS_GROUP_WAIT_S | 30 | Wait before the first message, to group |
ALERTS_UPDATE_EVERY_S | 300 | Least time between updates of one alert |
ALERTS_REPEAT_EVERY_S | 14400 | Reminder while nobody has acknowledged it |
ALERTS_REOPEN_WITHIN_S | 900 | A return within this reopens the same alert |
ALERTS_CHECK_TIMEOUT_MS | 2000 | Statement limit for one check |
ALERTS_DB_DOWN_AFTER_S | 30 | Failing database calls before the direct message |
ALERTS_SLACK_BOT_TOKEN | none | From Secrets Manager, never an environment file |
ALERTS_EMAIL_FROM | none | SES sender address |
BEAT_EVERY_S / BEAT_MISSED / STUCK_AFTER_S | 10 / 3 / 60 | Heartbeat timing (A7) |
Thresholds per rule (1 s lock wait, 60 s behind, and so on) live in alert_rule.threshold, edited in the admin panel. Who is told about what changes without a deploy. A new client, sport or team is a settings change, not a code change.
Retention
Every run table gets a cleanup job. A nightly job deletes old rows in batches of 10,000 by their time index, table by table, under its own time limit, so there are no long locks.
| What | Kept |
|---|---|
Alert history (alert, alert_event, alert_send) | 1 year |
Signals (alert_signal) | 7 days |
| Run records (integration runs, stat jobs, delivery attempts, dead letters) | 30 days |
| Logs | 30 days in CloudWatch |
| Metrics | 15 days, on lasting storage |
Today, integration runs, stat jobs and dead letters have no cleanup. The outbox has a 30-day prune (packages/core/src/omnium_core/jobs_outbox.py:75) that nothing calls. Delivery attempts are pruned at 14 days (delivery_history_days, packages/core/src/omnium_core/settings.py:244). CloudWatch log retention is set in the separate infrastructure repo, which was not checked.
Files
| File | New or changed | What it holds |
|---|---|---|
core/src/omnium_core/alerts/api.py | new | raise_, raise_alone, clear: the only way any code raises an alert |
core/src/omnium_core/alerts/rules.py | new | The rule registry (code, kind, default severity, runbook) |
core/src/omnium_core/alerts/fold.py | new | Read signals with the outbox reader, fold into alert and alert_event |
core/src/omnium_core/alerts/checks.py | new | The condition rules, one function per rule |
core/src/omnium_core/alerts/send.py | new | Timing, mutes, roots, routes; records alert_send |
core/src/omnium_core/notify/slack.py | changed | From a webhook POST to a bot-token client that posts once and edits |
core/src/omnium_core/notify/email.py | new | Amazon SES sender |
core/src/omnium_core/observability/logging.py | new (moved) | The JSON formatter from the API, plus trace id, command id and subject; setup_logging(service) |
core/src/omnium_core/observability/beat.py | new | Beat: writes process_beat every 10 s |
worker/src/omnium_worker/alerts/__main__.py | new | The alert service |
| command service, stats, worker and admin entry points | changed | Call setup_logging; start a Beat in each loop |
core/src/omnium_core/publishing/delivery/deadletter.py | changed | The Slack stub goes; a dead letter raises delivery-behind |
admin/src/omnium_admin/routers/alerts.py | new | Inbox, detail, health and rule reads for the console |
flows/src/omnium_flows/ops/ | new | Workflow commands: ops.acknowledge_alert, ops.mute, ops.resolve_alert, ops.edit_alert_rule, ops.edit_alert_route |
deploy/observability/prometheus/alerts.yml | changed | The 5 rules are removed once the matching checks run |
The ops.* commands are written like any other workflow command. See how workflow code is written.
Order of work
- Migration: the new tables, the first rules with their runbooks, and one team route with its Slack channel left empty until it is named.
- Shared JSON logging in core, switched on in every service. Nothing else changes.
- Beats from every loop, and the Health page reading them.
- The alert service on staging with sending off, console only, for one week, to measure the noise. Then Slack on. Then email.
- Replace the Slack stub and keep dead letters in the database.
- The trace id from the bridge header through command, outbox, build and send.
- The nightly cleanup.
- Remove the 5 Prometheus rules once their checks run; move Prometheus to lasting storage.
Parked AWS steps wait for Section 14 (parked 7 Oct): the CloudWatch alarm on the alert service's beat (A8), email through SES (N6), the Slack token in Secrets Manager, and lasting storage for Prometheus (N8). Nothing is done on AWS without asking first.
Until Section 14: the console inbox and Health page work fully. Slack works with its bot token typed into the admin panel, encrypted like client credentials (Section 9, D9). Email waits for SES. Nothing outside watches the alert service yet, which is a known gap. As a stop-gap, every console screen shows a red banner when the alert service has not beaten for 60 s.
Tests that prove it
| Test | Proves |
|---|---|
A raise inside a rolled-back transaction leaves no signal; raise_alone survives the rollback | A1 |
| 8 senders raise one key at once: one alert with count 8, and no sender waits on a lock | N1, N2 |
| A signal that commits late is still folded | N1 |
| A clear resolves; a raise within 15 minutes reopens the same alert id | A3 |
| While a root alert is open, its children are kept but not sent | A4 |
| A mute ends with the alert still open: it is sent again | A4 |
| With a fake clock: grouping at 30 s, updates at 5 min, reminders at 4 h | A6 |
| Two alert services: only the lock holder sends | N3 |
| A check over 2 s is cancelled and does not block the others | N4 |
A worker that beats but makes no progress with work waiting raises worker-stuck | A7 |
| Database down for 30 s: one direct message, then none for 15 minutes | A8 |
A traceparent sent to the bridge appears on the command, the outbox row and the delivery log line | A9 |
| Every rule code raised anywhere in the code exists in the seed | A5 |
| Slack answers 429 three times: retried, and a critical alert also goes by email | Failure cases |
Screens
Staff see every alert and the health of every part in the console, in plain words, with the next step written on the alert. All of this is Agreed, to build and not built.
| Screen | What a person sees and does | Reads | Writes (commands) |
|---|---|---|---|
| Bell in the console header | Count of open critical and warning alerts for my team. Click opens the inbox | alert (open, by team), pushed live through the Section 8 stream | none |
| Alerts inbox | One row per problem, worst first, in plain words: "NDTV S3 is 4 min behind". Filters: open, mine, muted, resolved | alert, alert_mute | none |
| Alert detail | What the rule checks, its timeline (raised, each send, acknowledged, resolved), what to do, links to the match, integration or destination, and "show logs" for its trace id | alert, alert_event, alert_send | ops.acknowledge_alert, ops.mute, ops.resolve_alert (needs a note) |
| Health page | One line per part: scoring (command time), imports (last good run), file builds (freshness), delivery (age per destination), pull (hits a second, Redis hit rate), workers (beat, version, last progress). Green, amber or red, each linked to its alert | process_beat, delivery_state, integration runs, metrics summary | none |
| Rules and routes (admin panel) | Each rule: severity, team, channels, threshold, what to do. Teams with their Slack channel and email list. Active mutes | alert_rule, alert_route | ops.edit_alert_rule, ops.edit_alert_route |
| Slack message | One message per alert, edited in place as it changes, with a link to the alert in the console | sent by the alert service | none |
A condition alert has no Resolve button, because it resolves itself when the cause clears.
A scorer never sees system alerts. They see only their own command answers (Section 4), such as "The system failed on this command. Our team has been alerted. Reference 7f3a." The reference is the alert key, so support can find it in one search.
When things go wrong
The rule for every case: an alert can be late, but it is never lost and never silent. When the database itself is the problem, the alert service tells people without using the database.
| What goes wrong | What happens |
|---|---|
| The alert service crashes | Signals keep being added as rows, so nothing is lost. On restart it folds from where it stopped. CloudWatch raises an alarm after 60 s with no beat (after Section 14; until then, the red console banner) |
| The database is down | Code cannot add signals, and the command fails anyway. The alert service sees its own reads failing for 30 s and sends "database unreachable" straight to Slack and email, using no table. The AWS database alarms are a second line |
| Slack is down or limits us | Each send is retried with growing waits. The console still shows the alert. A critical alert that fails on Slack 3 times also goes by email. Each send is recorded with its result |
| One problem hits 1,000 matches | Grouping sends one message per rule, "lock wait: 1,000 matches", with the list in the console. The count rises; no new message until the next 5-minute update |
| A problem comes and goes | It reopens the same alert within 15 minutes and updates the message. It never sends a new alert each time |
| A rule is too noisy | A person mutes it for a set time with a reason. Mutes are recorded. If the alert is still open when the mute ends, it is sent again |
| A command rolls back | Its signal rolls back too, which is right for most alerts. Alerts about the failure itself, such as "refused after 5 tries", use raise_alone in their own small transaction |
| Signals commit out of order | The late-commit-safe reader does not skip them (Section 4, L9) |
| Two alert service copies run during a deploy | Only the holder of the advisory lock folds and sends. The other waits. A crash between a send and its record can repeat one message once. It can never lose one |
| A worker is alive but stuck | The beat comes from the work loop and carries progress_at. Work waiting with no progress for 60 s raises worker-stuck, even while it beats |
| A process clock is wrong | Beats and ages are compared with database time, not the process clock |
| Log volume in a storm | Errors are never dropped. One line per command stays. Debug lines are off on prod |
| The checker cannot read Prometheus | metrics-unavailable is raised as a warning; the Postgres-based checks keep running |
Decisions
All 22 decisions were agreed on 7 Oct 2026.
| # | Decision | In plain words |
|---|---|---|
| A1 | One alert service in our repo. Every part raises alerts with alerts.raise_, which adds an alert_signal row in the cause's own transaction | No part forgets to tell anyone, and an alert storm never slows a command |
| A2 | Two kinds of rule: event rules raised by code, and condition rules checked every 15 s. Condition alerts resolve themselves | Some problems are moments, some are states; both end as one alert |
| A3 | One open alert per key (rule plus subject). Repeats raise a count. A return within 15 minutes reopens the same alert | One problem is one alert, never 50 messages |
| A4 | Group by rule; hide downstream alerts while their root alert is open; mute only with a reason and an end time | A database outage sends one message, not 200 |
| A5 | Rules and routes are admin panel settings. Critical goes to Slack and email, warning to Slack, info to the console only. A phone call can be added later | Who is told about what is changed without a deploy |
| A6 | Wait 30 s to group, update at most every 5 minutes, repeat every 4 hours until someone acknowledges | Fast enough to act, calm enough not to be ignored |
| A7 | Every background process beats every 10 s with its version and last progress. Three missed beats raise "worker silent"; work waiting with no progress for 60 s raises "worker stuck" | A dead or frozen worker is found in 30 to 60 seconds, not by a client |
| A8 | The alert service is watched from outside: a CloudWatch alarm on its missing beat. It reports "database unreachable" without using the database | The watcher is watched, and the worst failure still gets through |
| A9 | One trace id (W3C traceparent) from the bridge through command, outbox, build and delivery. Every service writes JSON logs with the same fields | One search shows the whole path of a change |
| A10 | A short list of product numbers. Speed and freshness alerts use two windows (1 hour and 5 minutes) | We watch the promises made in Sections 1 to 9, not CPU graphs |
| A11 | The console gets a bell, an Alerts inbox, alert detail and a Health page. Acknowledge, mute and resolve are workflow commands | Staff act on alerts where they already work, and every action is recorded |
| A12 | Unexpected errors become alerts, grouped by error type and place, carrying the trace id. No new outside tool | We see crashes without buying another product |
| A13 | Keep alert history 1 year, signals 7 days, run records 30 days, logs 30 days in CloudWatch, metrics 15 days on lasting storage. Every run table gets a cleanup job | Tables stop growing forever, and history survives a restart |
| N1 | alert_signal only ever gets new rows, read with the xid8 late-commit-safe reader; raise_ also sends pg_notify | Raising is cheap and never makes commands wait on each other |
| N2 | alert has a partial unique index, one open row per key | The database itself makes sure one problem is one alert |
| N3 | The alert service is its own small service, one working copy by advisory lock | A crash elsewhere cannot silence alerts; two copies never double-send |
| N4 | Condition rules are named queries in code, 2 s limit each, on a 2-connection pool | Checks are safe, reviewed and cannot load the database |
| N5 | process_beat, one row per process, every 10 s, from the work loop, in database time | Silent and stuck workers are both found |
| N6 | Slack through a bot token (post, then edit the same message); email through Amazon SES; every send recorded in alert_send | One message per alert that updates itself, with proof it was sent |
| N7 | trace_id on the command table, domain_event (already has the column), feed_document (the last 20 trace ids it was built from) and delivery_attempt. One shared JSON log setup in core | Every service logs the same way, and one id joins them |
| N8 | Prometheus keeps its data on lasting storage (chosen in Section 14). The checker reads latency percentiles through the Prometheus API | Speed alerts work, and history survives a restart |
| N9 | A nightly cleanup deletes old rows in batches of 10,000 by their time index, table by table, under its own time limit | Tables stay small without long locks |
Built today, or still to build
| Piece | Today (7 Oct 2026) | Agreed design | Status |
|---|---|---|---|
| Alert rules | 5 Prometheus rules, loaded but sent nowhere (deploy/observability/prometheus/prometheus.yml.tmpl:10-11, alerts.yml) | Checks in the alert service; the 5 rules removed | Partly built |
Alert service, alert_signal, alert and the other alert tables | Not in the code | One service, one open alert per key | Agreed, to build |
| Dead-letter Slack alert | Logs "slack alert (seam, not sent)" (packages/core/src/omnium_core/publishing/delivery/deadletter.py:161) | A dead letter raises delivery-behind | Agreed, to build |
| Slack sender | Real webhook sender, off and never called (packages/core/src/omnium_core/notify/slack.py:64, settings.py:169-170) | Bot-token client that posts once and edits | Partly built |
| None | Amazon SES | Parked | |
| Dead letters saved | Log only by default (packages/core/src/omnium_core/settings.py:189) | Kept in the database | Partly built |
| JSON logs | Public API only (packages/api/src/omnium_api/observability/logging.py:28); workers plain text (packages/worker/src/omnium_worker/__main__.py:196, scheduler/__main__.py:157, stats/__main__.py:215); admin sets none | One shared setup in core, same fields everywhere | Partly built |
| Trace id | domain_event.trace_id exists, but a new id is made at the outbox (packages/core/src/omnium_core/jobs_outbox.py:68); scoring passes none (scoring/pipeline.py:725) | W3C traceparent from the bridge to delivery | Partly built |
| Tracing (OpenTelemetry) | Public API only, off by default (packages/api/src/omnium_api/settings.py:81) | Replaced in practice by the trace id in JSON logs | Partly built |
| Queue metrics | Only ever set in tests (packages/worker/src/omnium_worker/observability.py:226) | Set by the loops; queue lag is a product number | Partly built |
| Heartbeats | Delivery log line every 30 s (packages/worker/src/omnium_worker/delivery.py:501-503); none elsewhere | process_beat from every loop every 10 s | Agreed, to build |
| Health checks | Fixed "ok" (packages/admin/src/omnium_admin/routers/health.py:17, packages/core/src/omnium_core/observability.py:47-52) | Health page from beats and product numbers | Agreed, to build |
| Prometheus storage | Inside the container, lost on restart, 15 days (deploy/observability/prometheus/Dockerfile:20-25) | Lasting storage | Parked |
| Watching the alert service | Nothing | CloudWatch alarm on a missing beat; red console banner until then | Parked |
| Console bell, inbox, detail, Health page | Not built | As in Screens | Agreed, to build |
| Cleanup jobs | Outbox prune never called (packages/core/src/omnium_core/jobs_outbox.py:75); delivery attempts pruned at 14 days (settings.py:244) | Nightly cleanup for every run table | Partly built |
Numbers
All measured on a local laptop (Postgres 17.9, database bench_s4, Python 3.12) on 7 Oct 2026, from the Section 11 design doc.
| What | Cost |
|---|---|
| Raise: add one signal, 8 senders on one key | 0.21 ms per insert, 2,555 transactions a second |
| The rejected way: update one alert row, 8 senders | 27.9 ms per insert, 247 transactions a second (they queue on the row lock) |
| A whole command when it raised by updating the alert row | 32 ms, against 3 ms |
| Fold 47,709 signals into 401 alerts | 64 ms |
| One JSON log line | 6.9 µs |
| Record one histogram and one counter | 2.4 µs |
A normal command writes one log line and two numbers, about 12 µs (from the doc's sum of the costs above). Against the 1.48 ms median transaction measured in Section 4, that is under 1%. A command that raises an alert pays 0.2 ms more.
Numbers from the code: Prometheus scrapes every 15 s (prometheus.yml.tmpl:7) and keeps 15 days (Dockerfile:25); the delivery heartbeat is every 30 s (delivery.py:124); FTP sends have a 30 s time limit (settings.py:224).
Read next
- Feeds and delivery:
delivery_state, dead letters, and the files thedelivery-behindrule watches. - The database: the late-commit-safe reader that
alert_signaluses, and how cleanups avoid long locks. - Lessons from the Games: the problems found by people looking that this section answers.